This Viz is available on Tableau Public

The MOTO
As Pride Month concludes, let's remember its purpose by shedding light on the profound mental distress experienced by the LGBTQ+ community.
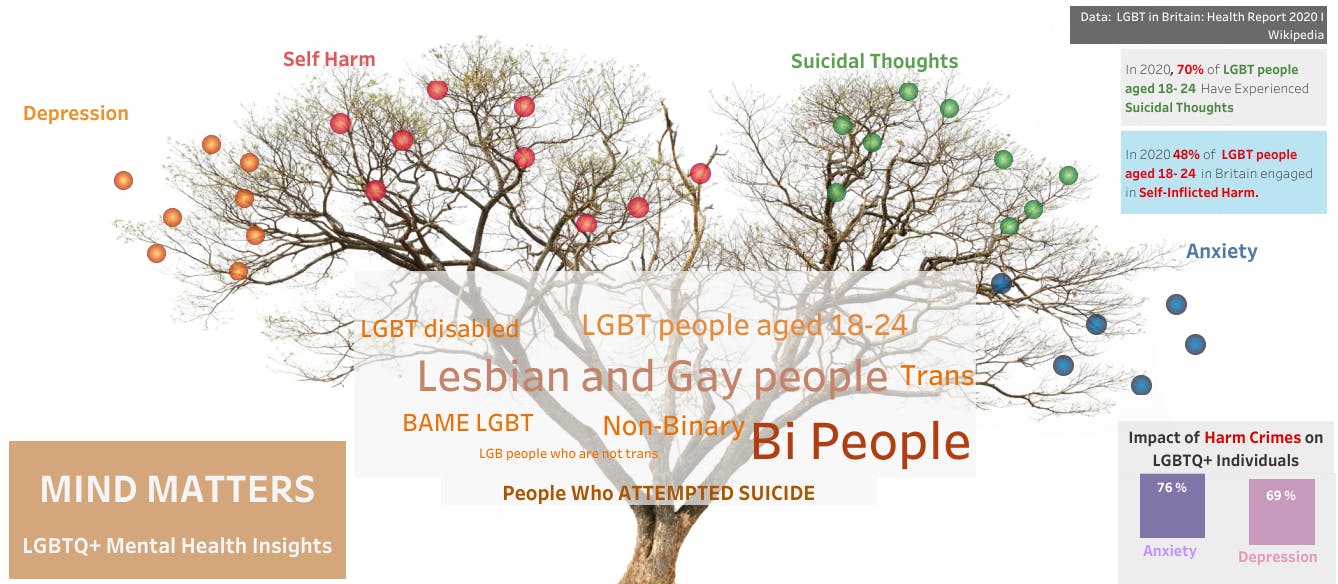
In this visualization project, I sought to depict mental health as a resilient yet weathered tree, standing tall amidst adversity.
Its branches, once vibrant, now serve as a poignant representation of various mental conditions faced by individuals, including anxiety, depression, suicidal thoughts, and self-harm.
At the heart of the tree lies a "word cloud" capturing the staggering percentages of suicide attempts within different LGBTQ+ communities.
Meanwhile, the fruits hanging from the branches symbolize the profound impact of these mental challenges.
Notably, the top right corner reveals the community grappling with the highest percentage of suicidal thoughts and self-inflicted harm.
In the bottom right corner, the visualization illuminates the chilling repercussions of hate crimes targeting the LGBTQ+ community on their mental well-being.
Together, let us strive for understanding, empathy, and change, as we navigate the complex landscape of LGBTQ+ mental health.
Salient Visualizations in Project
Word Cloud:
💡Search YouTube for detailed examples- Density Plot:
Visualizing fruits, over dry branches; a Density Plot can be handy!
Follow the step:
Plot the Viz between Two or more Data Labels,
Under the "Marks " below the filters, on the left side of Tableau
Choose Density
You Can Change the color gradient.
- Description Box:
Drag the columns required in the "TEXT" label under the "Marks box"
On clicking the "Text" label, you can change the font size, color, and description you want to write using the selected columns.
- Filters:
To apply filters, drag the column (on which you want to apply the filter) into the filter label
Right Click on the column, Edit Filter
You can Filter based on General, Wild Cald, Condition, and Top
In this project, I have used the "Top" option.
PS:) Do Comment with your thoughts about this!

