
IPL Data Analysis
IPL Analytics Unleashed: Delving into IPL Trends and Performances using Python


With the conclusion of this year's IPL, it's time to keep our cricket enthusiasm alive and kicking! Even though the dataset may be old, we're determined to mine the old gold and extract valuable insights.
Project Brief
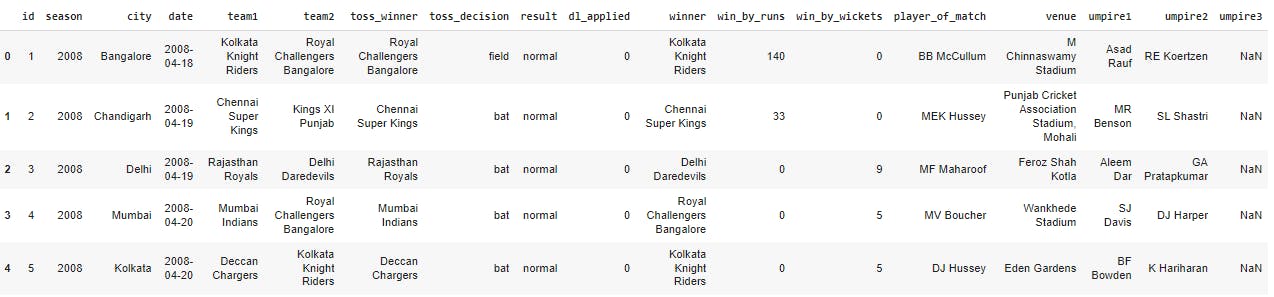
The Dataset is as follows:
The project encompasses five main analysis steps.
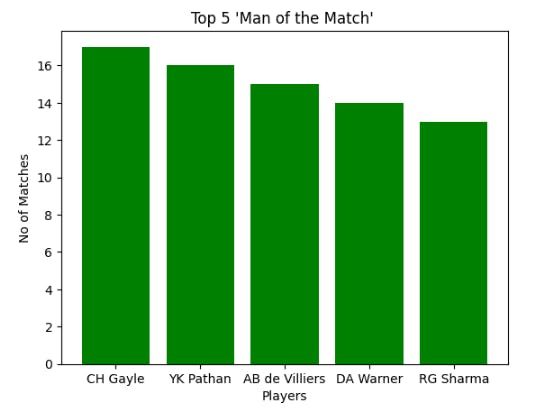
Step 1: The focus is on identifying the player who had been awarded as the Man of the Match the most.
ipl['player_of_match'].value_counts()[0:5]
Out[ ]:
CH Gayle          17
YK Pathan         16
AB de Villiers    15
DA Warner         14
RG Sharma         13
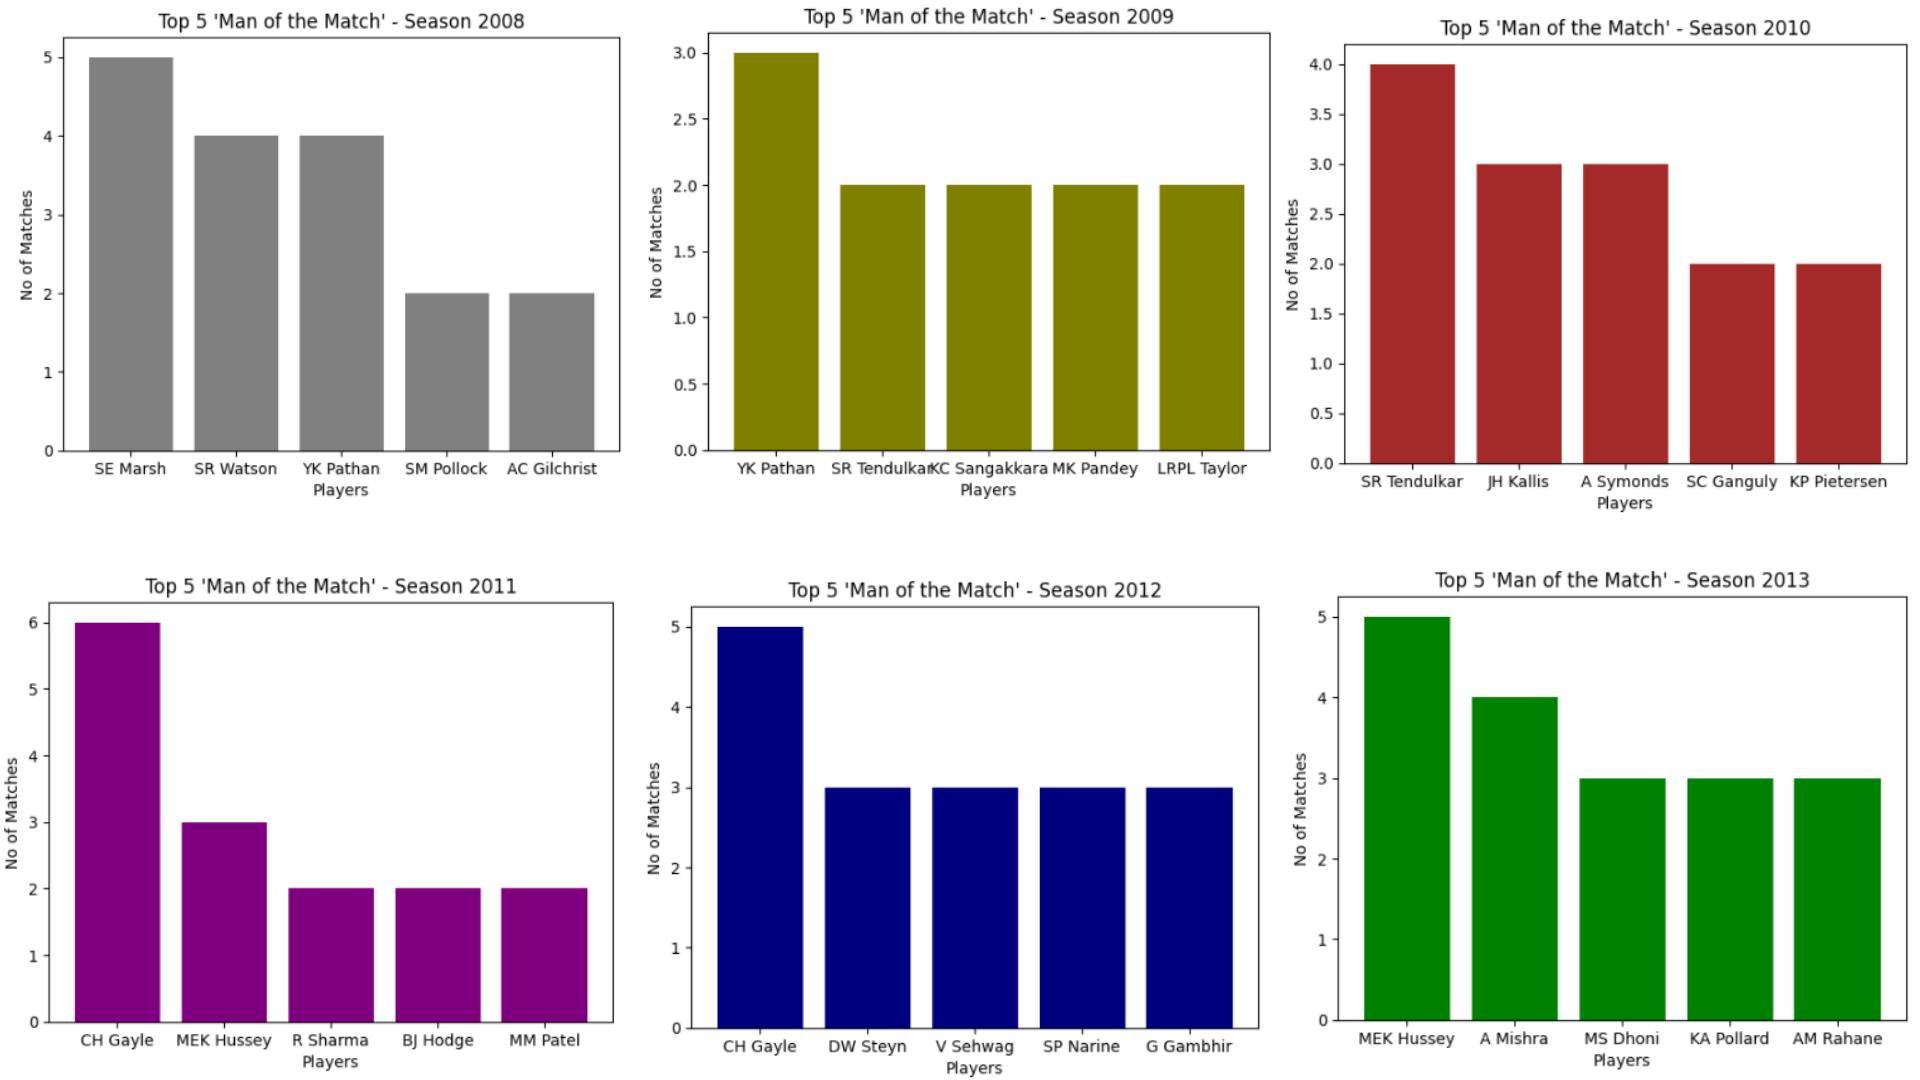
This analysis has been conducted at two levels.
Firstly, at the overall dataset level:
Secondly, at the season-wise level to determine the top four players who won the title, most of the time.
Different colors have been assigned to each graph to enhance visibility and distinguishability. The implementation of a “while loop” facilitated the iterative process for each season.
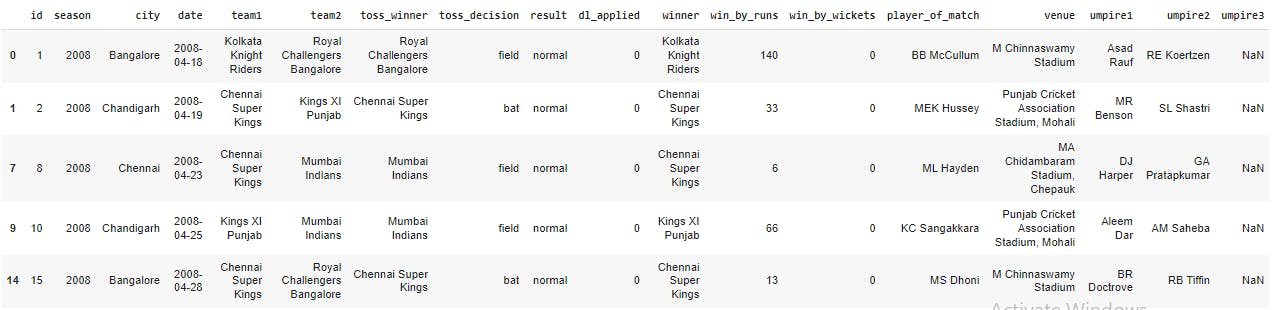
Step 2: The analysis focuses on the outcomes of matches when the winning team opts for the first batting.
The primary objective is to understand the results based on the win_by_runs column. Various operations are performed, followed by the creation of histograms and bar graphs to visualize the findings
batting_first= ipl[ ipl['win_by_runs'] != 0]

batting_first.head()
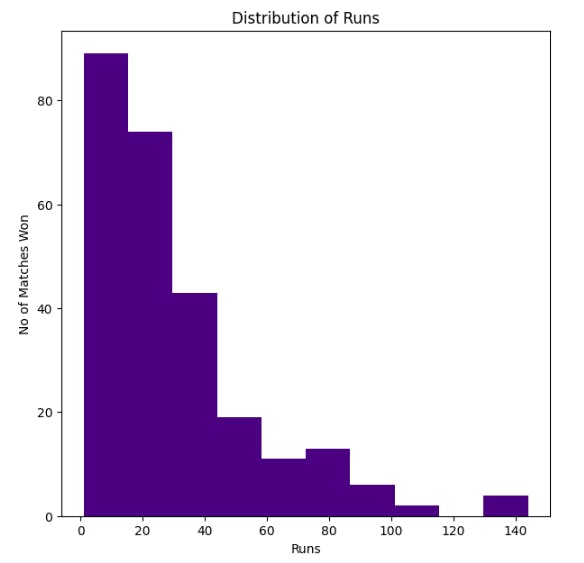
The "Win by Runs Vs Runs" plot reveals interesting insights.
It shows that more than 80 matches have been won with a margin of 20 runs, while only a few matches were won with a margin of 140 runs.
This distribution helps us understand the competitiveness of matches based on the runs scored.
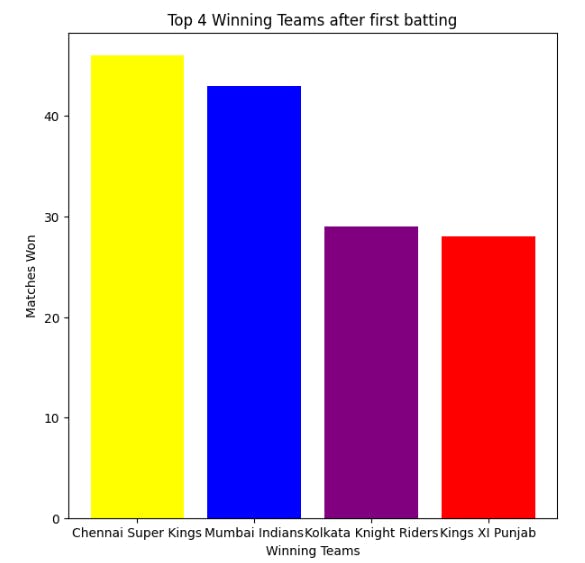
The bar graph displays team-wise wins when batting first. It provides a comparison of the number of wins for each team, giving us an idea of their performance in such scenarios.
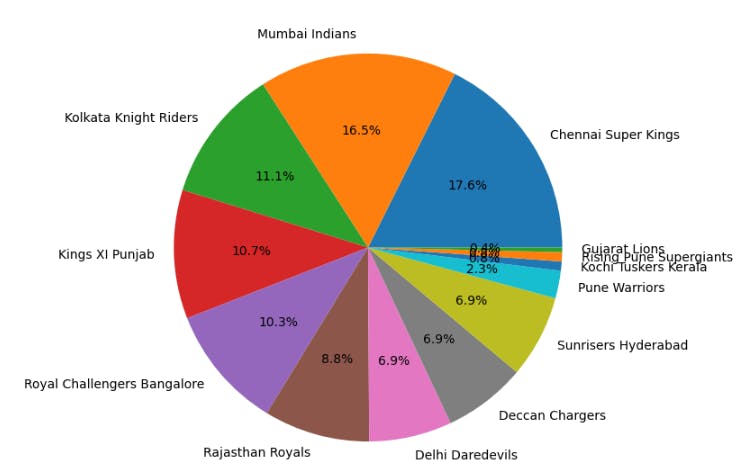
Additionally, a pie chart is used to represent the win percentage distribution for all the teams that bat first.
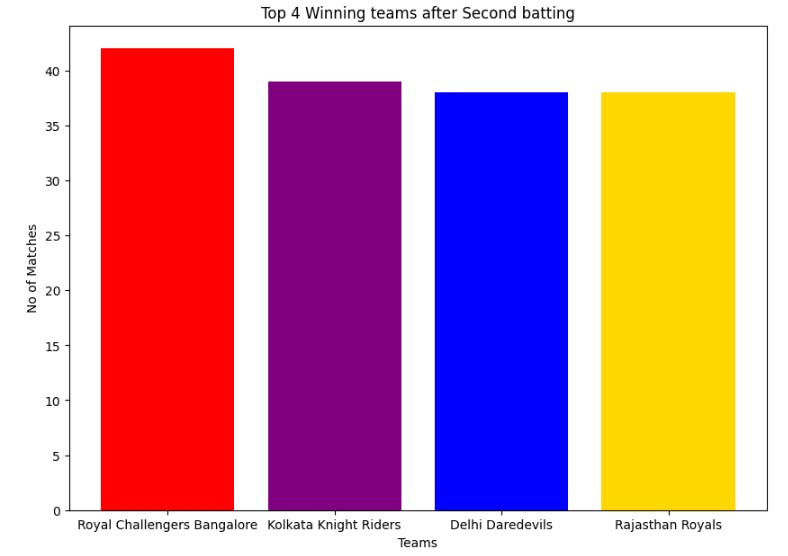
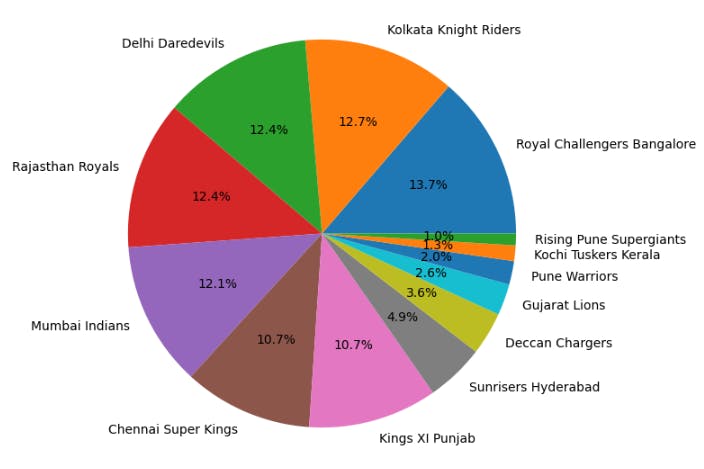
Step 3: The analysis focuses on the outcomes of matches when the winning team opts for bowling first.
The objective is to understand the results based on the win_by_wickets column. Similar to the analysis for the first batting team, various operations are performed, and histograms and bar graphs are created to visualize the findings.
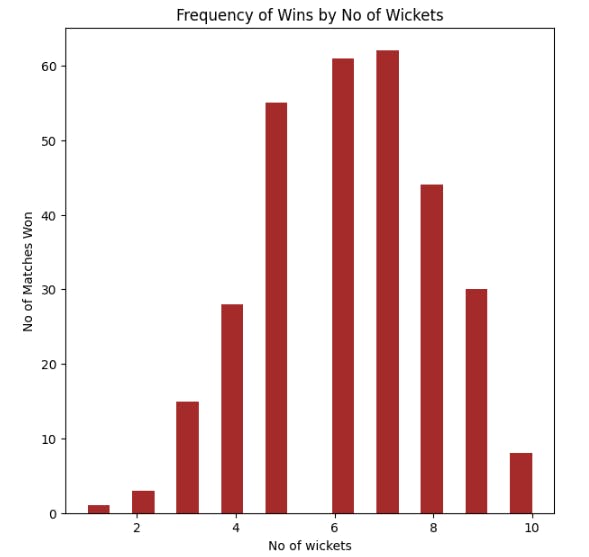
The "Win by Wickets Vs Wickets" plot provides valuable insights into the matches won by different wicket margins. It reveals that a significant number of teams have won matches by a margin of 7 wickets, indicating a substantial gap between the winning team and the opponent. On the other hand, only a few teams have won matches by a margin of 1 wicket, indicating closely contested encounters.
The bar graph displays the team-wise wins when opting to bowl first. It allows for a comparison of the number of wins for each team, providing an understanding of their performance in such scenarios.
The pie chart provides a visual representation of the proportion of wins for each team and helps identify any dominant teams or patterns.
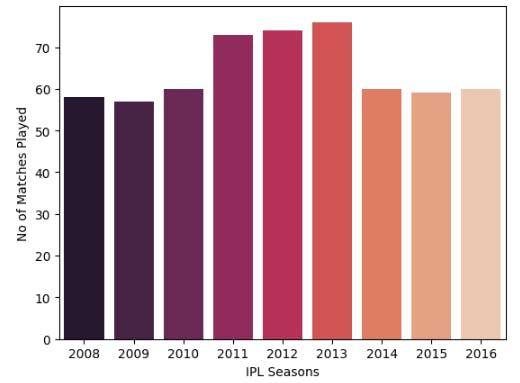
Step 4: The aim is to understand the distribution of matches across different seasons of IPL.
Step 5: The analysis involves exploring the probability of the toss winner being the same as the match winner.
This aspect is particularly intriguing as it sheds light on the impact of winning the toss on the final outcome of the match.
The analysis reveals that the toss winner and the match winner coincide in approximately 50.43% of the matches.
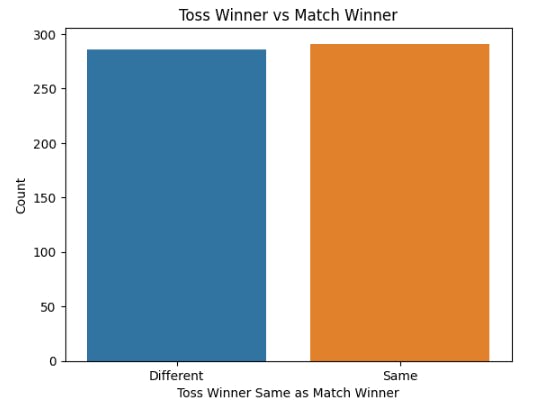
This finding highlights the importance of the toss and its influence on the overall result of the match.
Conclusion
Using Python and data analysis libraries such as Pandas, NumPy, and Matplotlib, we explore the rich dataset of IPL matches and delve into key factors that contribute to a team's success. We examine batting and bowling performances, player-of-the-match awards, toss outcomes, venue analysis, and more.
My GitHub
The dataset contains the data from the IPL season 2008 to the IPL season 2016.
Software-
Google Collaboratory